September continued where August left off in retail produce sales.
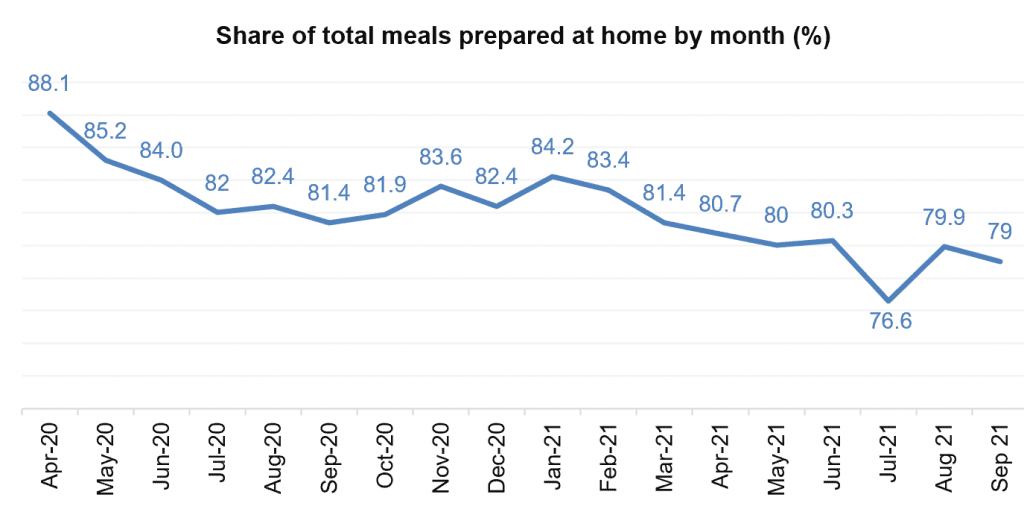
“The multi-month normalization of consumption and grocery shopping patterns came to a halt in August hand-in-hand with an uptick in COVID-19 case counts,” said Jonna Parker, Team Lead Fresh with IRI. “In September, the IRI survey of primary grocery shoppers once more found an elevated share for at-home meal preparation, at 79%, compared to the July low of 76.6%.”
At the same time, the survey found that more people returned to buying groceries online. During the height of the pandemic, as many as 20% of trips were online.
This dropped to a low of 11% in July. In August, the online share of trips increased to 13% and in September the share reached 14%.
“Generally speaking, an opportunity gap remains for fresh produce when comparing how often center-store items land in online baskets versus perishables,” Parker said. “However, produce is leading the way for fresh items, representing 12 out of the top 15 fresh items in household penetration when regarding online baskets among our panelists. While there is room to improve, consumers are starting to rely on their local grocer to pick the fresh produce for them, which is an important area of growth in coming weeks, months and years.”
Between the changes in consumer consumption and buying patterns, high inflation and severe supply chain disruption and constraints, fresh produce retailing remains in flux. IRI, 210 Analytics and the Produce Marketing Association (PMA) have teamed up since March 2020 to document the ever-changing marketplace and its impact on fresh produce sales.
Year-to-Date Sales
The first nine months of the year brought $504 billion in food and beverage sales. September marks the return to year-over-year sales growth in dollars, up 0.1%. Dollar gains in most categories were boosted by robust inflation, but unit and pounds did start to trend close to 2020 levels also. Perishables, including produce, seafood, meat, bakery and deli, had the highest year-over-year gain during the first nine months of 2021, at +0.9%. Frozen foods had the highest increase versus the pre-pandemic normal of 2019, at +22.6%.

Fresh Produce Engagement Remains High
The stellar 2020 performance for fresh produce was secured by better trip conversion and an increase in spend per trip. In 2021, engagement remained high with only small decreases that could be attributable to farmers’ markets, road side stands and other alternative formats opening back up.
- 8% of American households purchased fresh produce at least once in the first three quarters of 2021. That is virtually unchanged, down a mere 0.3% from the same period in 2020.
- During January through September, fresh produce buyers averaged 56.4 product trips, which was down 0.6% but still highly elevated versus 2019.
- Shoppers spent an average of $8.55 per trip, that was up 1.4% over the same period in 2020.
- For the first nine months, shoppers spent a total of $482.34 per buyer, which was up 1.6% over 2020.
Source: IRI, Integrated Fresh household panel, all outlets, total produce department YTD through 9/26/2021
Food Inflation
Food prices in both the retail and restaurant settings are seeing significant inflation. IRI-measured price inflation shows that prices continued to rise over and above their elevated 2020 levels for total food and beverages. In September, both total food and beverages and fresh produce had inflation averaging 5%-6% over the same weeks in 2020.
“Consumers are noticing that their weekly groceries are more expensive, as is gasoline and virtually everything else,” said Joe Watson, VP of Membership and Engagement for PMA. “But one statistic from the USDA Economic Research Service (ERS) caught my eye last week. And that was that Americans spent 7.8% less on food in 2020 than the year before as a result of eating more meals at home versus eating out. With food-away-from-home inflation growing even faster than retail inflation, shoppers are continually reminded that home-cooked meals are both less expensive and often healthier. These are important messages for retailers to underscore amid inflation along with subdued promotional activity.”

Week-by-Week Sales Fresh Produce
Fresh produce sales were very consistent with August levels around $1.3-$1.4 billion each week. Despite the high consumer demand in 2020, sales exceeded last year’s levels and remained about 16% ahead of the 2019 pre-pandemic normal.

“September delivered the strongest year-on-year results we have seen since having to go up against the pandemic sales peaks in March,” said Watson. “Both fruit and vegetables saw higher gains in September. For fruit, year-on-year gains improved to +8.8% and vegetables are now very close to year-ago levels, at -0.7%. If the growth trajectory remains the same, vegetables will be back in the plus come October.”
The difference in fruit and vegetables year-over-year performance lies in their 2020 sales results. Vegetables had much higher gains in 2020, which means a tougher road for growth this year. Additionally, fruit has experienced slightly higher inflation thus far in 2021 than vegetables, which boosts dollar sales gains.
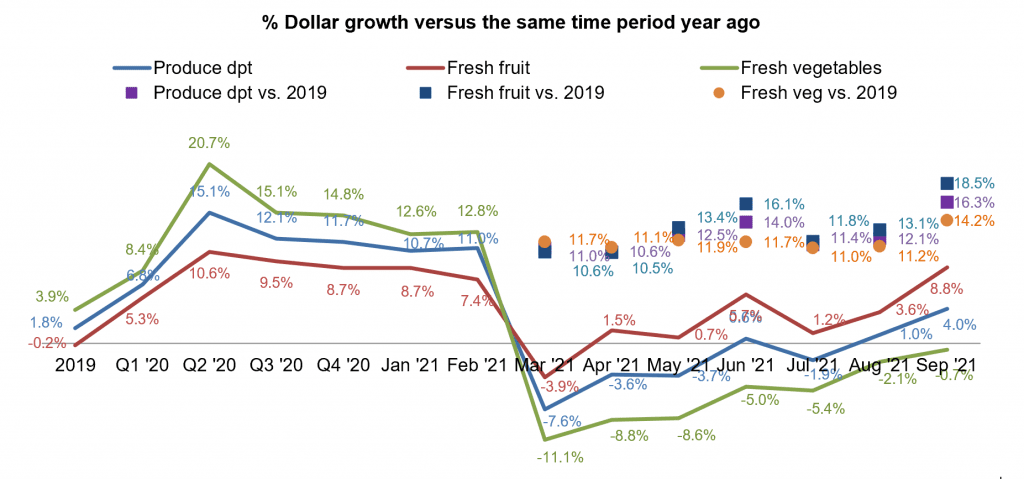
Year-to-date, prices for total fresh produce are about 6% higher than they were last year. Inflation for fruit is above average, at +7.6% year-to-date through September 26. Fruit prices during September 2021 were 8.9% higher than in September 2020.

Fresh Share
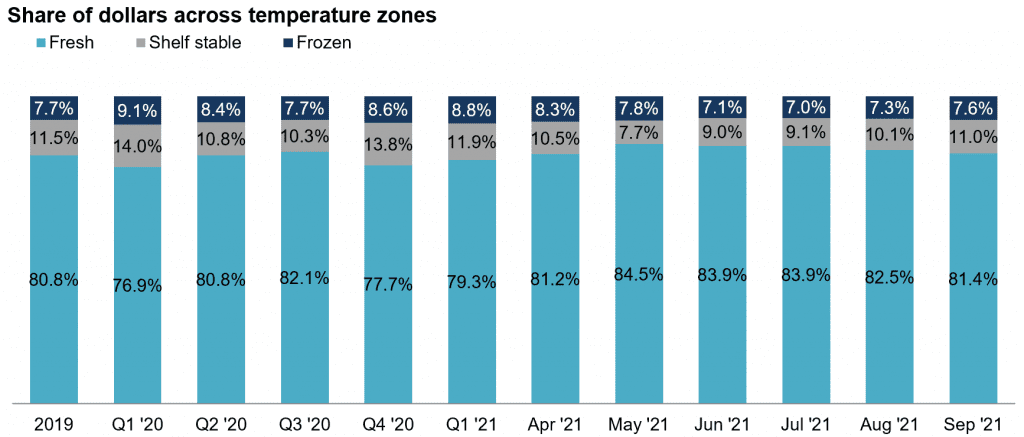
In canned, fruit also outperformed vegetables. Fruit sales increased 7.5% in September 2021 versus year ago compared with -5.8% for shelf-stable vegetables. Frozen fruit and vegetables could not hold the line and decreased 2.8% in year-over-year sales. All are still benefiting from robust demand versus the 2019 pre-pandemic normal.

“The fresh share of total fruit and vegetable dollars across the store dropped for the second consecutive month,” said Watson. “As we saw a bit of a reversal in the normalization of shopping patterns, specific to produce this means that both frozen and shelf-stable took a little share from fresh, much like they did at the onset of the pandemic. At the same time, we also have to keep in mind that inflation levels were different across fresh, canned and frozen, which has an impact on the share of dollars.”
Fresh Produce Dollars versus Volume
The gap between the fresh produce dollar and volume performance persisted in September. Produce pounds remained below year ago levels. However, both dollars (+16.3%) and pound sales (+9.6%) tracked well ahead of 2019’s rates — meaning retail continues to sell many more pounds of fresh produce in September 2021 than it did pre-pandemic.
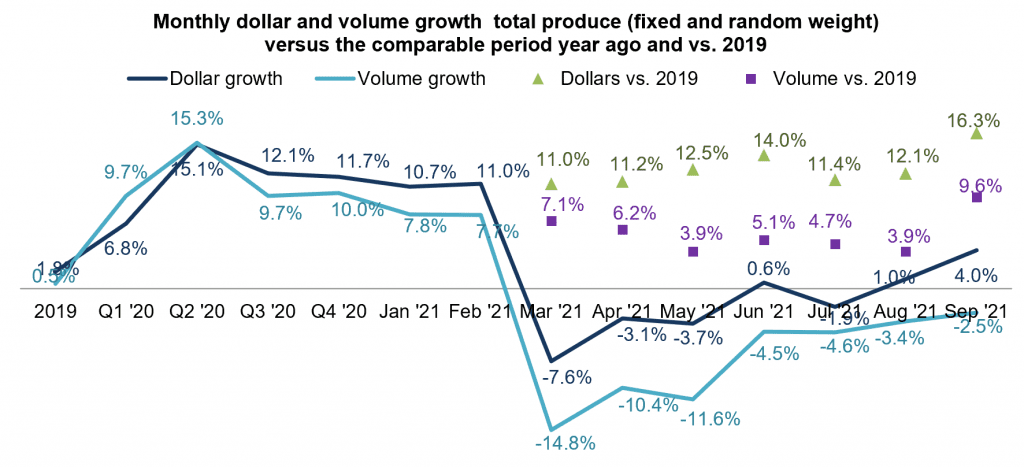
Comparing September pound sales versus the pre-pandemic 2019 normal is particularly impressive. Free and clear of the effect of inflation, it shows that U.S. retailers sold 11.4% more pounds of fruit and 7.7% more pounds of vegetables in September 2021 than the same month in 2019. While volume is down year-over-year, it shows that the home-centric meal consumption is still driving robust demand for produce at retail.

Fresh Fruit Sales in September
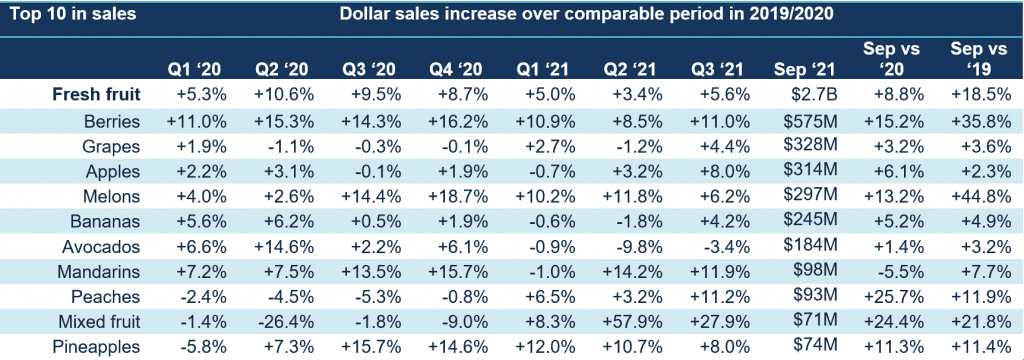
“We had quite a few changes in the top 10 in absolute dollars for fruit this month,” said Parker. “While berries remained the uncontested number one in sales, grapes and apples became the new number two and three, bumping melons down to fourth place. Cherries dropped out of the top 10, as expected with seasonality, making room for pineapples.”
Only mandarins were not able to meet or beat the 2020 September sales levels, down 5.5%. All other fruits were up, with the highest gain for peaches that were up 25.7%.
Fresh Vegetables Sales in August
“Whereas the fruit top 10 changes around every month, vegetables are much more consistent,” said Watson. “Vegetables generated $2.6 billion in September — rapidly approaching 2020 levels. But across categories, the performance is much more mixed than we see in fruit. Packaged salads sales have been terrific ever since the onset of the pandemic, but other areas including potatoes, peppers and mushrooms trailed behind last year’s numbers.
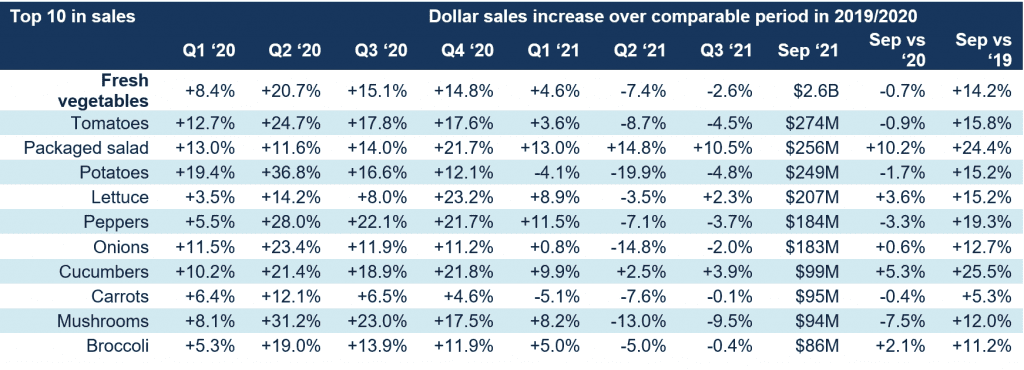
Absolute Dollar Gains
“The top 10 in absolute sales show both small and large categories are important for department growth,” said Parker. “Berries and salad kits are mainstays from month-to-month, but cherries, mixed fruit and nectarines show that smaller sellers can be big contributors too — often highlighting the fun seasonal nature of produce that can prompt impulse purchases.”

Perishables Performance
A look across fresh foods departments for the four September weeks shows perimeter strength. All department gained year-over-year, with the highest increases going to deli and meat. Seafood is significantly smaller than the other fresh departments, but had very aggressive growth in 2020 and managed to still come ahead in September 2021.

Floral
Year-to-date through the week ending October 3, floral grew sales by 24.9% over the same period in 2020. Sales approached $6 billion. While some of the growth is boosted by inflation, unit sales increased 13.3% over this same period and volume increased 15.8%.

What’s Next?
A few months ago, nine in 10 Americans expected to celebrate the winter holidays like normal, according to a June survey by 210 Analytics. However, the upswing in COVID-19 case counts in the fall is once more disrupting the Halloween through New Year’s Day holiday celebrations.
 A second wave of the study in September found that 51% of grocery shoppers now expect COVID-19 to have some level of impact on their plans rather than celebrating like normal. In 2020, the winter holiday gatherings were smaller and home-centric and it is likely that 2021 will see some of the same. The altered shopping patterns, that include more online shopping and fewer, but larger trips, may favor fruit and vegetables with longer shelf life as well as push more dollars to frozen and canned. Helping shoppers plan for the week can be a great way to keep the dollars in fresh produce.
The next report, covering October, will be released in mid-November. We encourage you to contact Joe Watson, PMA’s Vice President of Membership and Engagement, at jwatson@pma.com with any questions or concerns. Please recognize the continued dedication of the entire grocery and produce supply chains, from farm to retailer. #produce #joyoffresh #SupermarketSuperHeroes.
Date ranges:
2019: 52 weeks ending 12/28/2019
Q1 2020: 13 weeks ending 3/29/2020
Q2 2020: 13 weeks ending 6/28/2020
Q3 2020: 13 weeks ending 9/27/2020
Q4 2020: 13 weeks ending 12/27/2020
Q1 2021: 13 weeks ending 3/28/2021
Q2 2021: 13 weeks ending 6/27/2021
Q3 2021: 13 weeks ending 9/26/2021
September 2021: 4 weeks ending 9/26/2021
"fruit" - Google News
October 14, 2021 at 08:51PM
https://ift.tt/3j2r80x
Inflation prompts shifts in fruit, vegetable demand – Produce Blue Book - Produce Blue Book
"fruit" - Google News
https://ift.tt/2pWUrc9
https://ift.tt/3aVawBg
Bagikan Berita Ini


0 Response to "Inflation prompts shifts in fruit, vegetable demand – Produce Blue Book - Produce Blue Book"
Post a Comment